
The Hidden Cost of Guessing: Why Sales Rep Metrics are Your Team's Competitive Edge
You have invested thousands in monthly lead generation. Your agents are extremely busy with calls, texting clients, buyer appointments and listing presentations.
Everything seems to be working as expected for your agents.
However, most team managers make decisions without seeing or knowing the performance of their agents.
Most managers also believe that their lead generation is successful, but again, this is a guess and not fact-based.
Most managers are making these decisions based on intuition rather than using data. And yes, I understand, tracking data can feel like an added burden in addition to all the other responsibilities you have.
The difference between activity and results
Agents can create an illusion that they are being productive by creating an environment of constant motion and activity. The activity includes things such as phones ringing, their calendar is filled with showings, and the agent is constantly moving between appointments.
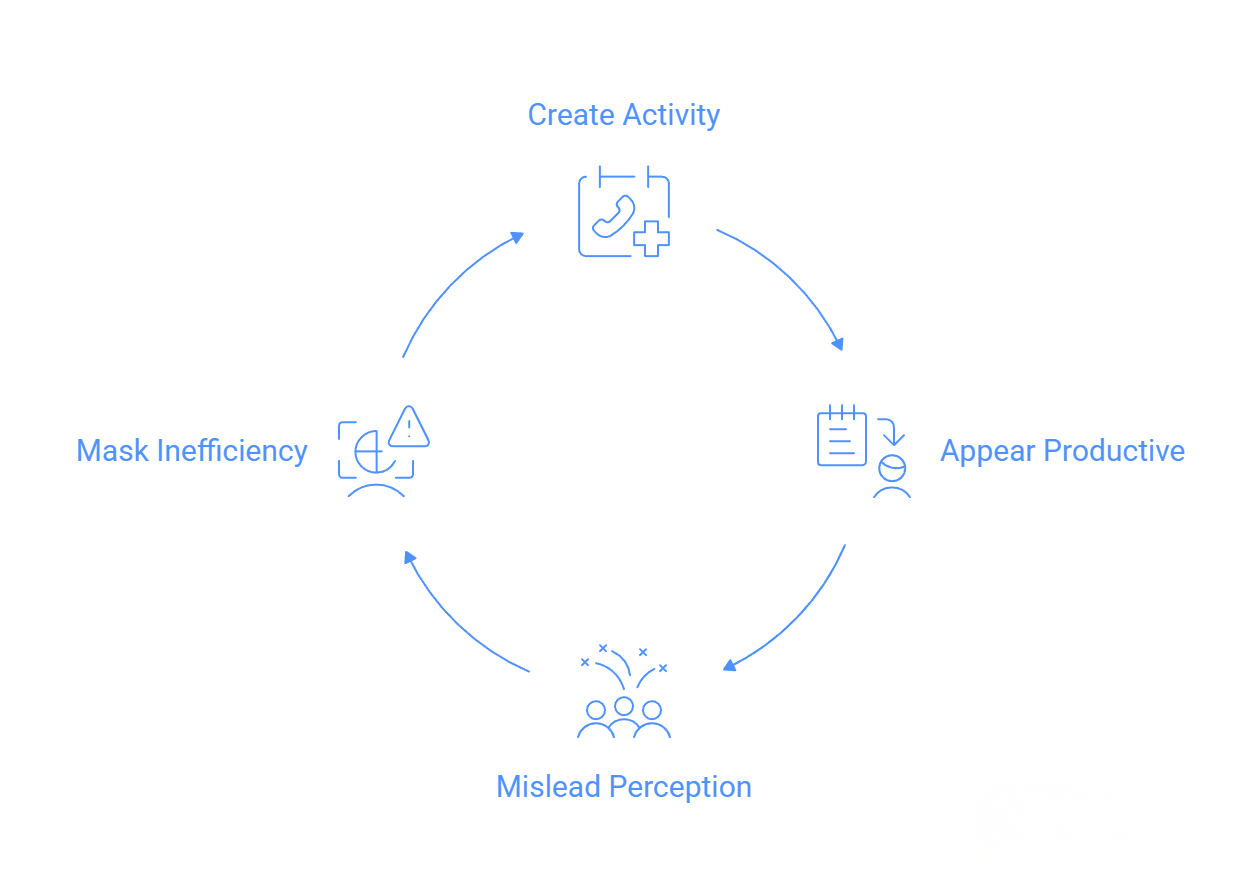
The agents may appear to be very active and therefore seem to be productive; however, when looking at activity verses actual results, we find two completely different animals.
For example, let's say one agent completes 15 buyer transactions in a quarter. At first glance, this looks great.
However, if we dig a little further into how many leads the agent had to go through to complete these 15 transactions, it could have been 800 leads. In contrast, another agent completed 14 transactions using only 200 leads.
This means the second agent was able to generate almost four times the return on each lead dollar spent for each transaction, or four times.
If the agent did not track these numbers, you would never have known the difference, and you may actually believe that the first agent performed better simply due to the fact that 15 is greater than 14.
Therefore, it is essential to understand what metrics your sales reps are using to measure and evaluate their performance. Sales rep metrics are measurable data that are used to evaluate and compare sales performance based upon the sales rep's activities, efficiency, and results during a specific time frame.
Three types of metrics
These metrics include three types, although the lines often blur between the three.
Sales activity metrics including but limited to calls made, buyer appointments scheduled, listing presentations delivered, showing appointments set, and pipeline value.
Sales performance metrics which include but are not limited to win rate, commission revenue generated, quota attainment, and listings taken verses listings presented.
Customer focused metrics also need to be tracked including but limited to Customer Lifetime Value (repeat clients and referrals), satisfaction scores, and client retention rates.
The metrics you choose depend entirely on your business goals. Though together they help identify trends, improve forecasting, and drive data-driven decisions that optimize your entire sales strategy.
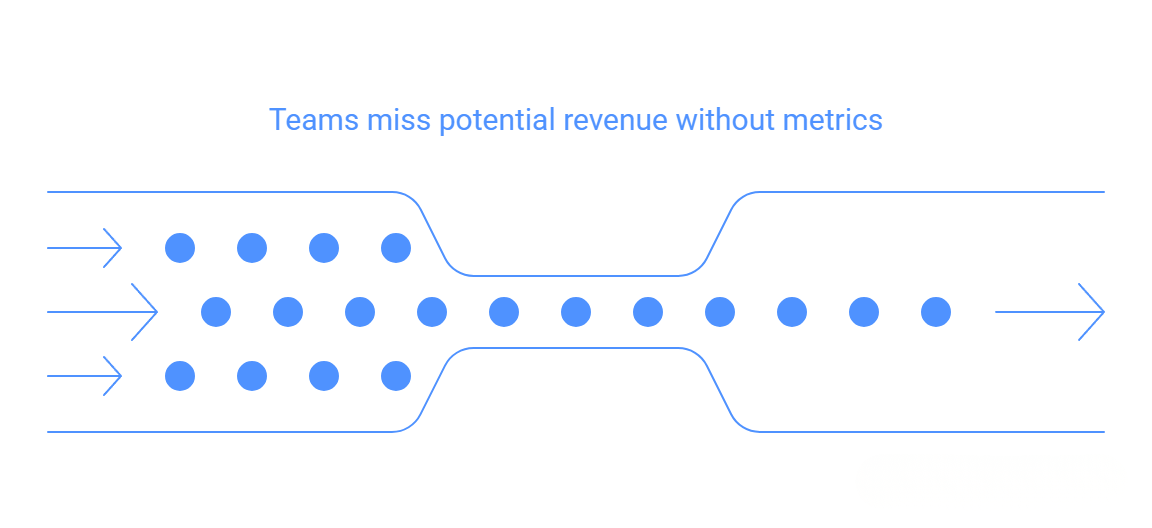
For teams, this means understanding not just how many leads come in—that part's easy—but how efficiently those leads convert into buyer appointments, listing agreements, and closed transactions.
The conversion piece is where most teams leak revenue without even realizing it.
It's not about who's busiest. It's about who's most efficient and most likely to drive actual ROI on every lead.
The metrics that matter
The distinction is clear between thriving teams and those that are struggling. Successful teams pay attention to both leading and lagging metrics.
For data-driven team management, understanding these metrics is a key building block.
Ignoring any one of them may cause major commercial losses.

Lagging indicators
Lagging indicators are about what has happened. Closed transactions, commission revenue that's been deposited, and expired listings are examples.
Important as they are in understanding what has transpired, they are also reactive. By the time you realize there are problems with the lagging indicators, the team has already missed opportunities and forfeited a large commission.
For example, in July, if you're reviewing second quarter numbers, you may discover the first quarter one was weak - something you could have fixed if you weren't looking at lagging indicators.
Leading indicators
Leading indicators, in contrast, are predictive. They give insight into the likely future state of affairs of a parameter, to allow a team to make changes before things worsen.
They also give insight into the likely state of the upcoming quarter and allow teams to take corrective actions.
The challenge lies in identifying which leading indicators actually matter.
The most critical leading indicators for agents
Conversations to appointments
This measures how many actual conversations an agent requires to schedule one buyer consultation or listing presentation. This metric counts real conversations, not dials or voicemails.
Top-performing agents average three to five conversations per appointment. When agents consistently need eight to ten conversations to set a single appointment, this signals a fundamental skills problem that costs the team deals every day.
The issue may be as simple as agents not asking for appointments, or it may indicate deeper problems with their approach.
Appointment ask percentage
Appointment Ask Percentage reveals surprising patterns across teams. Research shows that many agents only ask for appointments 25% of the time they speak with leads.
This means that three out of four conversations end without any attempt to schedule a showing, buyer consultation, or listing appointment.
Increasing this percentage to 50% or higher can double appointment volume overnight with the same number of leads and the same time investment.
Most agents do not realize they are failing to ask for appointments because no one is tracking this metric.
Appointment set to held rate
This one is critical because scheduled appointments have no value if buyers and sellers fail to attend. A held rate below 70% signals deeper issues.
Agents may be setting low-quality appointments with unqualified prospects, or they may be failing to build sufficient value in the initial conversation to overcome no-shows and cancellations.
Frequently both problems exist simultaneously.
Talk time percentage
Talk Time Percentage reveals whether agents understand that listening converts more effectively than talking. Call quality data shows when agents dominate conversations by speaking 70% of the time compared to the homeowner's 30%.
This ratio consistently prevents deals from closing because agents are not uncovering the real motivation, timeline, or objections.
Instead, they are simply delivering a pitch.
Objection handling rate
This tracks how often agents handle predictable objections smoothly. Common objections include "We already have an agent," "We're just starting to look," "We want to try selling ourselves first," and concerns about buyer agency agreements.
Every market has standard objections. Skilled agents handle these objections at least 80% of the time, converting them into deeper conversations.
Tracking how often objections derail conversations versus advancing them forward reveals which agents need coaching. Some agents will struggle with certain objections regardless of coaching intensity, and this information is valuable for management to understand.
The role of AI in tracking metrics
These conversation quality metrics, including appointment ask percentage, talk time ratios, and objection handling rates, are nearly impossible to track at scale without AI-powered call analysis. Sales managers who manually listen to calls can review perhaps three to five calls per agent weekly.
AI call grading systems such as MaverickRE can analyze every single conversation, providing instant visibility into these critical leading indicators across the entire team.
This allows managers to identify coaching opportunities in minutes rather than hours and ensures that no conversation patterns go unnoticed.
The real value extends beyond simply seeing the patterns to being able to act on them before they result in another month of lost deals.
Activity-based metrics that drive results
Beyond conversation quality, teams need visibility into daily activities that compound into closed deals. These metrics form the foundation of consistent production.

Call attempts per lead
Call Attempts Per Lead significantly impacts conversion rates. Most agents abandon leads after one or two failed attempts.
Data shows that 80% of sales require at least five follow-up attempts, yet 92% of agents give up by the fourth attempt. Teams tracking this metric often discover that agents are discarding quality leads prematurely, assuming they are uninterested when they simply need more consistent follow-up.
Speed to lead
Speed to Lead remains one of the strongest predictors of conversion success. Contacting a lead within five minutes improves qualification rates by 21 times compared to waiting 30 minutes.
After an hour, the lead may as well be dead for conversion purposes.
Yet most teams have no visibility into actual response times across their agent roster. The top performer might respond in two minutes while another agent averages two hours, but without measurement, both appear equal.
Follow-up frequency
Follow-Up Frequency determines whether teams capture the 35% to 50% of deals that close after the fifth interaction. Agents who make six to eight attempts before moving a lead to long-term nurture consistently outperform those who make three attempts.
This is not about being pushy. It's about understanding that buyers and sellers operate on their timeline, not the agent's.
Time spent in revenue-generating activities
Time Spent in Revenue-Generating Activities reveals the truth about agent productivity. Most agents believe they spend 60% to 70% of their day on productive tasks like prospecting, appointments, and follow-up.
Time tracking data shows the reality is closer to 30% to 40%.
The remaining time disappears into email, administrative tasks, social media, and other non-revenue activities. Teams that measure and improve this single metric often see immediate production increases without adding leads or agents.
Deal velocity metrics that predict success
Beyond individual conversations and activities, teams need visibility into how deals progress through the pipeline. These metrics reveal systemic bottlenecks that cost closed transactions.
Average days from lead to appointment
Average Days from Lead to Appointment shows how quickly agents move prospects forward. Top performers schedule appointments within seven to ten days of initial contact.
Struggling agents often take 30 to 45 days to achieve the same result.
This extended timeline kills urgency, allows competitors to intervene, and signals poor follow-up processes. Teams tracking this metric can identify which agents need help creating urgency and moving conversations forward.
Average days from appointment to contract
Average Days from Appointment to Contract varies by market but should remain consistent within a team. When certain agents consistently take twice as long to move from appointment to signed agreement, this indicates skill gaps in objection handling, negotiation, or closing techniques.
The metric also reveals which agents are working with unqualified prospects who will never convert regardless of time invested.
Pipeline value by stage
Pipeline Value by Stage provides predictability for future revenue. Teams should know exactly how much potential commission sits at each stage: new leads, qualified prospects, active buyers, under contract, and pending close.
This visibility enables accurate forecasting and reveals where deals stall.
If the pipeline shows $2 million in "qualified prospects" but only $200,000 ever progresses to "active buyers," there's a clear conversion problem at that specific stage.
Win rate by lead source
Win Rate by Lead Source prevents teams from investing in the wrong places. A lead source generating 500 leads monthly appears valuable until data reveals a 0.5% conversion rate.
Meanwhile, another source providing 50 leads monthly with a 4% conversion rate actually produces more closed deals.
Without this metric, teams optimize for activity instead of results.
The problem with not measuring
Most team leaders believe they understand their business. They can name their top producers, identify which agents seem busy, and have a general sense of lead flow.
This surface-level awareness creates a false confidence that prevents teams from discovering the gaps costing them millions.
Ask any team leader: What percentage of the time do your agents ask for appointments? Most will guess 60% to 70%. The data typically shows 25% to 35%.
Ask: What's your average speed to lead across all agents? They'll estimate 15 to 30 minutes. Reality often reveals two to three hours.
Ask: How many follow-up attempts do agents make before abandoning a lead? They'll claim five to seven. The truth is usually two to three.
These gaps between perception and reality explain why teams struggle despite having quality leads and capable agents. The pieces are present, but without measurement, they cannot identify which specific behaviors need adjustment.
Teams that avoid implementing metrics often share another characteristic. They are not growing.
Alternatively, they are growing but profitability is not keeping pace with revenue. Without measurement, teams cannot identify which activities drive profit and which create unproductive work.
They cannot determine which lead sources deserve more investment and which should be eliminated. They cannot coach effectively because they are guessing which skills need development.
They make decisions based on the agents who are most vocal, not on the most accurate data.
The real cost of operating blind
The gap between what teams could earn with proper metrics versus what they actually earn without them is substantial.
This is not theoretical. Real money is being lost every month.
Consider a team of ten agents, each handling approximately 300 conversations monthly. This is a realistic volume for agents working a combination of inbound leads and outbound prospecting.
This equals 3,000 total conversations per month, or 36,000 annually.
If agents ask for appointments only 25% of the time, which data shows is common across many teams, this results in 750 appointment requests monthly. At a 40% conversion rate from request to scheduled appointment, this generates 300 appointments per month.
This appears reasonable.
However, consider what happens when this single metric is improved.
The impact of improving one metric
Model the same scenario with agents asking for appointments 50% of the time. This is not unrealistic with basic training and accountability.
This yields 1,500 appointment requests, converting to 600 appointments monthly. This represents 300 additional appointments, double the original volume, from the exact same 3,000 conversations.
The same leads, the same time investment, and the same agents are involved.
The only difference is asking more frequently.
At a 30% close rate from appointment to transaction, those 300 additional appointments generate 90 extra closed deals monthly, or 1,080 annually. At $12,000 average commission, this equals $12,960,000 in annual commission revenue.
This revenue is lost simply because agents are not asking for appointments consistently.
This represents only one fixable metric.
The compound effect
Now consider the compound effect across multiple unmeasured metrics. These include conversion rate variations by lead source, where teams may generate leads from sources with 1% close rates instead of 4%.
They include appointment held rates, where teams may have 40% show rates instead of 70%. They include talk time ratios, where agents who listen more convert at higher rates.
They include objection handling effectiveness, where skilled agents can convert "I have an agent" into appointments. They include time spent on revenue-generating activities, where agents may spend 40% of their day on productive tasks instead of 60%.
The cumulative impact for a mid-sized team easily reaches seven figures annually.
These are not hypothetical losses. They represent transactions that would have closed with the same leads, the same agents, and the same time investment if only the team had visibility into where conversations break down and conversion stalls.
The leads were already purchased. The agents were already on payroll.
The time was already spent.
The only difference is whether the team measured what happened and fixed what was not working.
Real-world results from measurement
Teams using comprehensive metrics reporting consistently see measurable improvements. Appointment rates increase 40% to 55%.
Held rates improve several hundred percent. Conversion rates climb quarter over quarter.
The data exists in every conversation, every lead interaction, and every appointment. The question is whether teams have systems to measure it and leaders willing to act on what the data reveals.
The gap between measurement and guesswork is not theoretical. Teams implementing comprehensive metrics tracking report transformational results.
One team with more than 100 agents using Zillow Flex increased conversions by 55% within months. Another team doubled their appointments in six weeks by tracking and improving appointment ask percentage from 25% to over 50%.
A third team saw held rates increase from 17% to 39% by monitoring appointment outcomes and implementing follow-up coaching.
These are not outliers.
They represent what happens when teams gain visibility into the metrics that matter and act on what they discover.
Moving from guesswork to certainty
The principle is straightforward.
Teams cannot improve what they do not measure.
Yet most teams still operate on gut instinct when data-driven precision is available.
The limitations of manual tracking
Manual spreadsheets served their purpose when teams were small and metrics were basic. However, they cannot provide the real-time visibility that modern lead flow and agent activity demand.
One misplaced formula or one extra zero in a complex calculation makes all downstream data unreliable. By the time the error is discovered, months of strategic decisions have been made based on corrupted information.
Determining where the error originated so that historical data can be corrected is typically impossible.
Teams usually must start over.
The scalability problem
Scalability becomes impossible with manual systems. A team leader managing five agents might spend two hours weekly reviewing spreadsheets and listening to key calls.
That same leader growing to 20 agents would need eight hours weekly. That represents a full workday just for performance review, leaving no time for actual coaching or strategy.
Purpose-built systems solve this problem. Whether managing five agents or 100, reviewing rules violations, identifying coaching opportunities, and sending accountability reminders takes the same 20 to 30 minutes.
The system scales. Manual processes do not.
At some point, teams are either implementing technology or remaining small.
These are the available options.
The competitive advantage of data
When teams implement these systems, the competitive advantage becomes obvious. One team knows their Zillow Flex leads convert at 4.2% with a 67-day average sales cycle, costing $2,100 per closed transaction.
Their competitor thinks their Zillow leads work reasonably well.
One team knows that Agent Sarah asks for appointments 62% of the time with a 35% acceptance rate, while Agent Mike asks 18% of the time with a 41% acceptance rate. Their competitor thinks Sarah simply has better leads.
Sarah does not have better leads. Sarah asks more often.
However, without the data, this would never be known.
This information gap compounds over time. The team with data optimizes continuously.
The team without data makes decisions based on assumptions and realizes months later they were incorrect. Operating without comprehensive metrics visibility in today's market means willingly competing at a significant disadvantage.
Competitors are using these systems.
The question is when other teams will begin using them.
Transform your business
Teams using MaverickRE are setting 55% more appointments, closing 20% more deals, and uncovering hidden revenue in leads they already own. Whether managing three agents or thirty, team leaders deserve clarity about where their business stands and where it is headed.
Stop guessing. Stop losing deals to follow-up gaps.
Stop wondering which agents need coaching.
👉 Book your free demo and discover how MaverickRE can turn your team's potential into measurable performance.