
How to Calculate Sales ROI: Is Your Team Profitable or Just Busy?
Your agents are dialing. Appointments are being set.
Deals are being closed. But there's the question that keeps team leaders awake at night: Are we actually profitable from our sales efforts?
Most teams exist in a world of optimism; "we're killing it" is the common phrase used, referring to gross commission income (GCI), without truly understanding what lies beneath.
Money pours out the door to fund wasteful marketing campaigns, ineffective lead sourcing, agents who cannot close deals, and systems that squander hours daily. All of this, in the name of making money, is simply an expensive hobby that happens to sometimes close deals.
Why the hobby mindset no longer works
The market has changed. Easy money is gone.
Every dollar you commit to spend — whether it's on Zillow leads, Realtor.com leads, Ylopo Leads, or some new lead sourcing platform, tech subscriptions, agent commissions, whatever — needs justification.
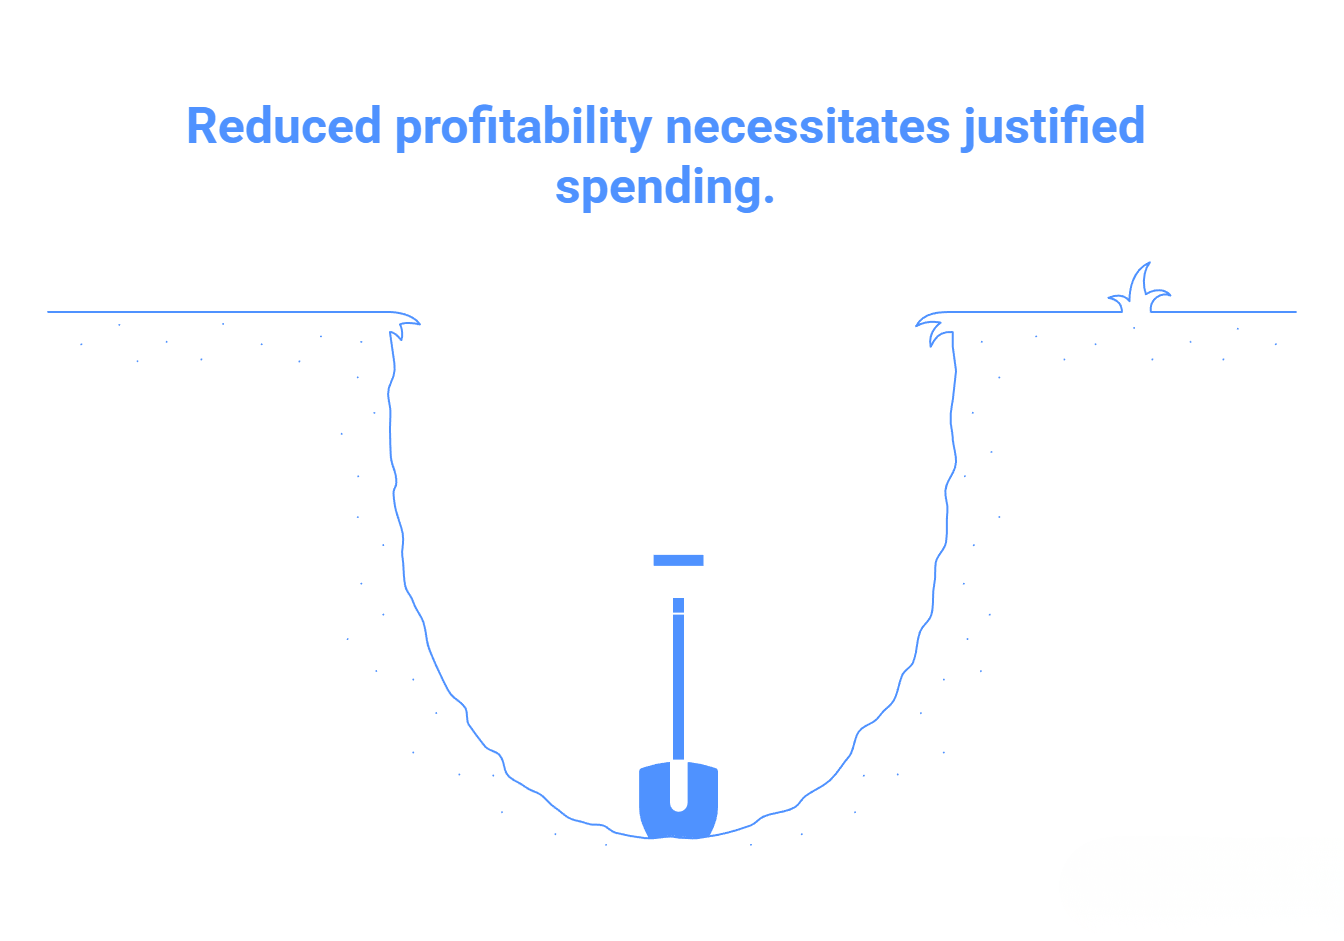
To survive, teams will need to achieve a minimum 3X return on investment on every dollar committed.
Not ambitious thinking, but mere survival.
What does this mean in reality? If you hire an Inside Sales Agent (ISA) for $50,000 per year, they'll have to generate an additional $150,000 in bottom line profit for your team.
Sales manager at the same salary? Same expectation.
If you're unable to measure whether your team is meeting expectations, you'll be unable to measure profitability. And if you're unable to measure profitability, you're essentially playing the odds.
The teams that will dominate the next 5 years are already measuring their metrics with precision.
These teams make data-driven decisions regarding lead sources, agent performance, and resource allocation, while their competition continues to rely on gut feeling and hope.
How do these teams measure their ROI?
It begins with understanding the fundamental formula that determines whether your investments are generating profits or quietly draining your business.
The ROI formula
The formula that sets winners apart from those barely surviving is deceptively simple:
ROI = ((Total Revenue – Total Cost) / Total Cost) x 100
This equation reveals whether your sales investments are generating profits or quietly bankrupting you. A positive ROI indicates a profitable investment.
A negative ROI means your costs outweighed your revenue — a reality check that too many leaders avoid until it's too late.
The five-step process to calculate sales ROI
Step 1: Determine your total sales revenue
This is the total GCI generated by your team's transactions during the measurement period. Most teams make their first mistake here: aggregating everything together instead of breaking down by source type, by agent, by time period.
When you aggregate everything, you miss the story your data is trying to tell you.
To accurately track your ROI, you must understand not just total GCI, but GCI by source type (Zillow Flex Leads vs. Realtor.com Leads vs. Sphere Leads). Track which agents are generating what revenue.
Without granularity, you'll never identify what is actually working.
Step 2: Define your total investment costs
Once you've determined your revenue, the next step is capturing every dollar you've spent to generate it. This is where the calculation falls apart for most teams — they forget hidden costs or don't track them systematically.
Your total investment costs include:
Agent splits & ISA commissions
Lead generation expenses (Zillow, Realtor.com, Opcity, etc.)
CRM and transaction management subscriptions
Marketing and advertising spend
Sales tools and software (dialers, texting platforms, AI tools)
Training and coaching programs
Team leader and sales manager salaries
Office overhead allocated to sales activities
Administrative support costs
Most teams fail at calculating ROI because they fail to account for their total investment costs. They'll remember the big-ticket items like their Zillow Flex budget, but forget about the $500/month CRM subscription, the $2,000 they spent on agent training, or the portion of their office rent that supports sales activities.
Step 3: Find the net profit
Subtract your total costs from your total revenue. This single calculation reveals whether your team is actually profitable, or simply generating activity.
Many team leaders are shocked — genuinely shocked — to discover that their "successful" operation is barely breaking even. Or worse, losing money once all costs have been properly accounted for.
This number — your net profit — is the only number that really matters to your business.
Gross commission income generates impressive headlines, but net profit pays your bills and funds your growth.
Step 4: Calculate the ROI
With your net profit identified, apply the formula:
ROI = (Total Revenue – Total Costs) / Total Costs x 100
This percentage tells you how much return you're getting for every dollar invested into your sales operations. Anything below 300% should raise questions regarding your resource allocation.
Elite teams typically operate between 400-600% ROI on their best-performing agents and lead sources.
Step 5: Interpreting the results and taking action
This is where most teams stop. They get their number and that's it.
However, the teams that actually win? They're just getting started.
They don't just calculate one aggregate ROI number — they calculate it by source type, by agent, by time period, by campaign.
The real power lies in comparative analysis. When you discover that your Zillow Leads convert at 2.5% while your Realtor.com Leads convert at 0.8%, you can make informed decisions regarding where to commit more capital.
When you see that Agent Roland's ROI is 450% while Agent Anaise's is 125%, you know exactly where to focus your coaching efforts — or which agents deserve premium lead flow.
A real-world ROI example
Let's assume an agent on your team generates $200,000 in GCI over the course of a year.
The total costs associated with that agent — including their split (assume a 50/50 split, so $100,000 to them), benefits if they're a W-2 employee, lead costs allocated to them, CRM fees, and other expenses — come to $80,000 in net cost to your team after their split.
Here's how the calculation works:
ROI = ($200,000 - $80,000) / $80,000 x 100
ROI = $120,000 / $80,000 x 100
ROI = 1.5 x 100
ROI = 150%
This means for every dollar your team invests supporting that agent, you're generating a $1.50 return. That's a 150% ROI.
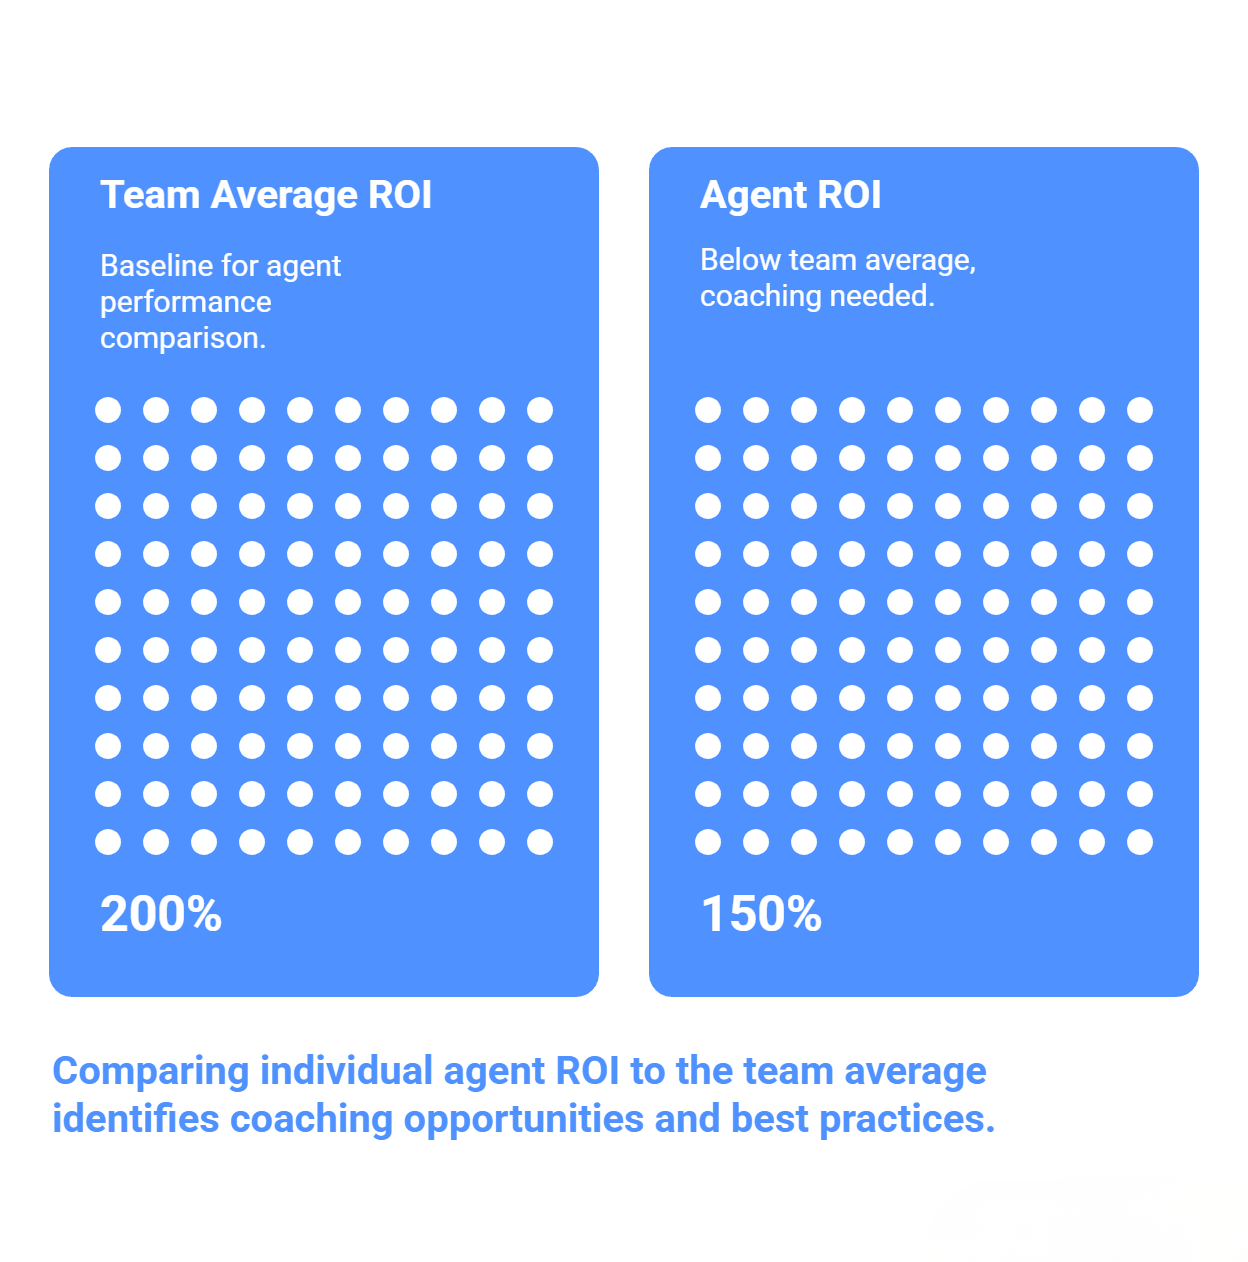
However, here's the critical question that separates average teams from elite teams: Is this agent performing above or below your team average?
If your team average is 200% ROI and this agent is at 150%, you've identified a coaching opportunity. Conversely, if this agent is above your team average, you want to understand what they're doing differently to replicate it.
The hidden leaks in your sales pipeline
Once you begin searching for the "leaks" in your sales pipeline, you'll find them at each step. Most teams are losing money at each stage and do not see that leakage due to lack of visibility.
The average team requires 7-8 conversations with a lead prior to setting a single showing appointment. However, most teams do not know what their conversion numbers are.
Agent A may need 12 conversations to get an appointment, while Agent B only needs 3. Additionally, most teams cannot determine which of their lead sources produce the best results.
As you delve further into the funnel, things get worse. If it takes 5 calls to initiate a conversation with a prospect and then 8 conversations to schedule an appointment, you're looking at 40 calls for each appointment.
Multiply this by your 10-20 agents, add in the expense of your leads ($15-$150) and the agent time involved in each call, and it becomes apparent why most teams struggle to achieve profitability despite being busy.
The conversion rate disaster
The numbers are absolutely terrible when you finally analyze them.
Industry data indicates that the average team closes approximately 1.2% of its leads from initial lead to final sale.
To put that in perspective, if you were to purchase 100 leads from Zillow Flex, Realtor.com Premier Agent, or another source, only 1-2 would result in a sale.
Breaking down conversion rates by stage in the sales funnel:
Calls to conversations: Most teams require 5-7 outbound calls to engage a prospect
Conversations to appointments: On average, teams require 7-8 conversations to set one showing appointment
Appointments to closings: Typically ranges from 10-25%
If a manager does not have this information regarding their own team, they are essentially working in the dark. Without this data, they cannot identify which part of their funnel is broken, cannot coach their agents on specific weaknesses, and cannot make informed decisions about budget allocation.
What true ROI tracking really entails
Elite teams obsess over efficiency metrics. They are well aware of their:
Calls to conversation ratios (Sunday calls may have an 8% success rate while Friday afternoons may have a 1% success rate)
Conversation to appointment ratios (to identify top-performing agents)
Appointment to close ratios (measured over time to identify trends)
Lead source ROI (including all hidden costs like CRM fees and follow-up time)
Individual agent performance (real-time updates, not quarterly)
Using this data, patterns emerge. Sunday evening calls tend to perform significantly better than Tuesday morning calls.
Agent Roland may convert Zillow leads at 4% while Agent Anaise converts at 1.5%, revealing that lead routing is almost as important as volume.
Additionally, your highest producing agents may not be the most efficient agents. An agent may close 30 transactions but have a poor conversion rate due to being fed a disproportionately large volume of leads.
Once you direct premium leads to the highest converting agents and provide targeted coaching, the compounding effect will transform your profitability.
The ROI time horizon
Profitability may not occur immediately, which is where many teams go wrong with their analysis.
More than 52% of lead conversions occur six months or longer after initial contact.
However, the overwhelming majority of agents stop following up with leads within 30 days and blame lead quality.
Perform ROI analysis over extended horizons. What may appear to be an unprofitable Zillow source in month one may turn into your most profitable source by month twelve — but only if you're tracking the long-term data.
Elite teams perform cohort analysis, tracking groups of leads over 12-24 months and analyzing conversions at different intervals.
Key considerations when calculating sales ROI
| Consideration | Why? | Takeaway |
|---|---|---|
| Time frame matters | A Zillow Flex lead at $150 with 1% close rate means $15,000 per closing in Q1. By year-end, when those leads convert at 2.5%, cost drops to $6,000 per closing. | Track both immediate and long-term value to avoid premature judgments on lead source profitability. |
| Market conditions create context | A 2% conversion during a market downturn might represent exceptional performance. The same 2% in a hot market could indicate problems. | Always benchmark against current market conditions, not just your historical performance. |
| Sales cycle length requires patience | First-time buyers might close within 60-90 days. Luxury buyers often take 12-18 months. Judging ROI after 3 months on a 9-month cycle misleads. | Build measurement timeframes around your actual sales cycle, not arbitrary calendar quarters. |
| Customer lifetime value multiplies returns | A buyer generating $12,000 in GCI looks like one transaction. But if they refer 3 additional transactions over 5 years, lifetime value hits $40,000-50,000 in total GCI. | Factor in repeat business and referrals to understand true customer acquisition cost ROI. |
Pro tips for calculating sales ROI
Use historical data as a reference point:
Analyze the last 12-24 months to create reasonable expectations.
If your team historically converts at 1.5%, attempting to reach 5% conversion without significant changes is overly optimistic. Establish achievable targets like 1.5%-2% in the next quarter and 2.5% by year-end.
Small incremental gains compound over time.
Segment your analysis ruthlessly:
Segment by lead source, agent, price point and farm area.
Aggregating numbers hides reality. One lead source at 8% conversion may be masking three others at 0.5%.
Although your overall 2% conversion rate may seem acceptable, you may be subsidizing failure.
Track non-monetary benefits:
Track referrals by agent and original lead source.
Typically, referrals convert at 20-30% versus 1-2% for cold online leads. Track sphere development to prevent short-term thinking and the loss of long-term benefits.
By recognizing the potential tradeoffs involved with implementing ROI tracking, teams can ensure that they are using the data to inform their decision-making, as opposed to simply tracking data for the sake of tracking data.
And if done correctly, the positive impact of using ROI metrics to optimize sales performance is clear.
The pros and cons of sales ROI calculation
Pros: Why this matters
Informed decision-making
ROI enables teams to determine which lead sources and strategies are most productive, and who among their sales teams are doing the best job. Teams can replace "gut feel" decisions with data.
When all members of the team know that Zillow Flex produces 3.5 percent conversions while Realtor.com produces .9 percent, it makes sense for the team to allocate its resources accordingly.
Optimized resource allocation
Once the ROI of various campaigns can be measured and compared, teams can understand where to invest their resources for the greatest return on investment.
By realigning their resources every quarter based on ROI, teams have been able to dramatically increase their profitability within 12 months. For example, spending $5,000 per month on leads that produce a 0.8 percent conversion rate versus a 2.5 percent conversion rate will make all the difference between being mediocre and achieving dominance.
Cons: The challenges
Complexity of accurate calculation
Accurately calculating the ROI of sales campaigns has proven to be a challenge for many teams. A big part of the problem lies in gathering accurate and complete cost information.
Hidden charges, shared resources, and overhead allocations all contribute to making it difficult to obtain a complete picture of total costs. The answer is not to avoid calculating ROI — it is to find ways to improve the process of collecting data so that accurate comparisons can be made.
Potential for misinterpretation
A single number or percentage does not provide enough context to fully understand the performance of a particular agent or strategy. For instance, an agent may have a low conversion rate but may be producing high-end clients that require longer sales cycles.
If you compare the ROI of leads that cost $100 to produce versus leads that cost $15 to produce, you are looking at two very different business models. Therefore, without understanding the context of the data, raw numbers can be misleading.
The path from data to dollars
Teams that track and use ROI metrics to optimize their sales performance are often rewarded with dramatic improvements. Conversion rates for teams have jumped from 1% to 2.2% — doubling their effectiveness.
Teams that tracked their data experienced increases in appointment settings from 15% to 30%. Individual agents have added $44,000+ in annual gross commission income — not a projection, an actual result.

There are several stages that teams go through when they start tracking ROI metrics:
Stage 1: Teams learn their baseline.
Most teams are surprised — they assumed they were getting 3-4% conversions, but in reality, they are only converting at 1.2%. Sometimes a wake-up call is needed to create the desire to improve.
Stage 2: Teams find out where their biggest leaks are.
In many cases, this is in the area of appointment setting. Agents rarely ask for appointments — 25% of the time versus the best practices of 80-100%.
With the identification of this leak alone, teams can potentially double the number of appointments overnight.
Stage 3: Teams begin to provide targeted coaching.
When agents realize they are needing 15 conversations per appointment and the rest of the team is only averaging 7, they quickly gain motivation. Coaching is now focused on specific actions — not generic suggestions to "do better."
Stage 4: Teams begin to reallocate their resources.
They prioritize their best converters with the best leads and eliminate unproductive channels. Investments in technology are now focused on areas that create the most bottleneck.
With continued measurement, coaching, and optimization, teams experience substantial compounded benefits. Teams are reporting 16X more appointments and 120% higher conversion rates within 18 months.
These are not anomalies — these are the typical results of tracking, coaching, and continually optimizing sales processes.
Your way forward
To commit to a data-driven approach to sales, you need a system to support it. MaverickRE offers comprehensive analytics capabilities necessary to track your ROI — conversion by stage, agent, and lead source in real-time.
Teams that utilize MaverickRE have seen the same results: 16X more appointments, 120% higher conversion rates, and individual agents adding $44,000+ to their annual gross commission income.
AI-based call grading, automated dashboards, and real-time pipeline analytics help identify your leaks before they turn into profit killers. While your competitors continue to operate in a state of blindness, you will have the data to remove your non-performers, coach to specific areas, and send your best leads to your top converters.
👉 Don't gamble with your six-figure decisions — start measuring what really matters.